COLLEGE-FOOTBALL Headlines & News
College Football News
-
 COLLEGE-FOOTBALL APR 24, 2026
2026-27 CFP Futures Odds: Ohio State Opens as Favorite
- COLLEGE-FOOTBALL DEC 27, 2025
Who Will Be Michigan’s Next Head Coach?: Michigan Next Head Coach Odds
- COLLEGE-FOOTBALL OCT 23, 2025
NCAA Division I Executives Vote To Remove Ban on College Athletes Betting on Professional Sports
- COLLEGE-FOOTBALL OCT 8, 2025
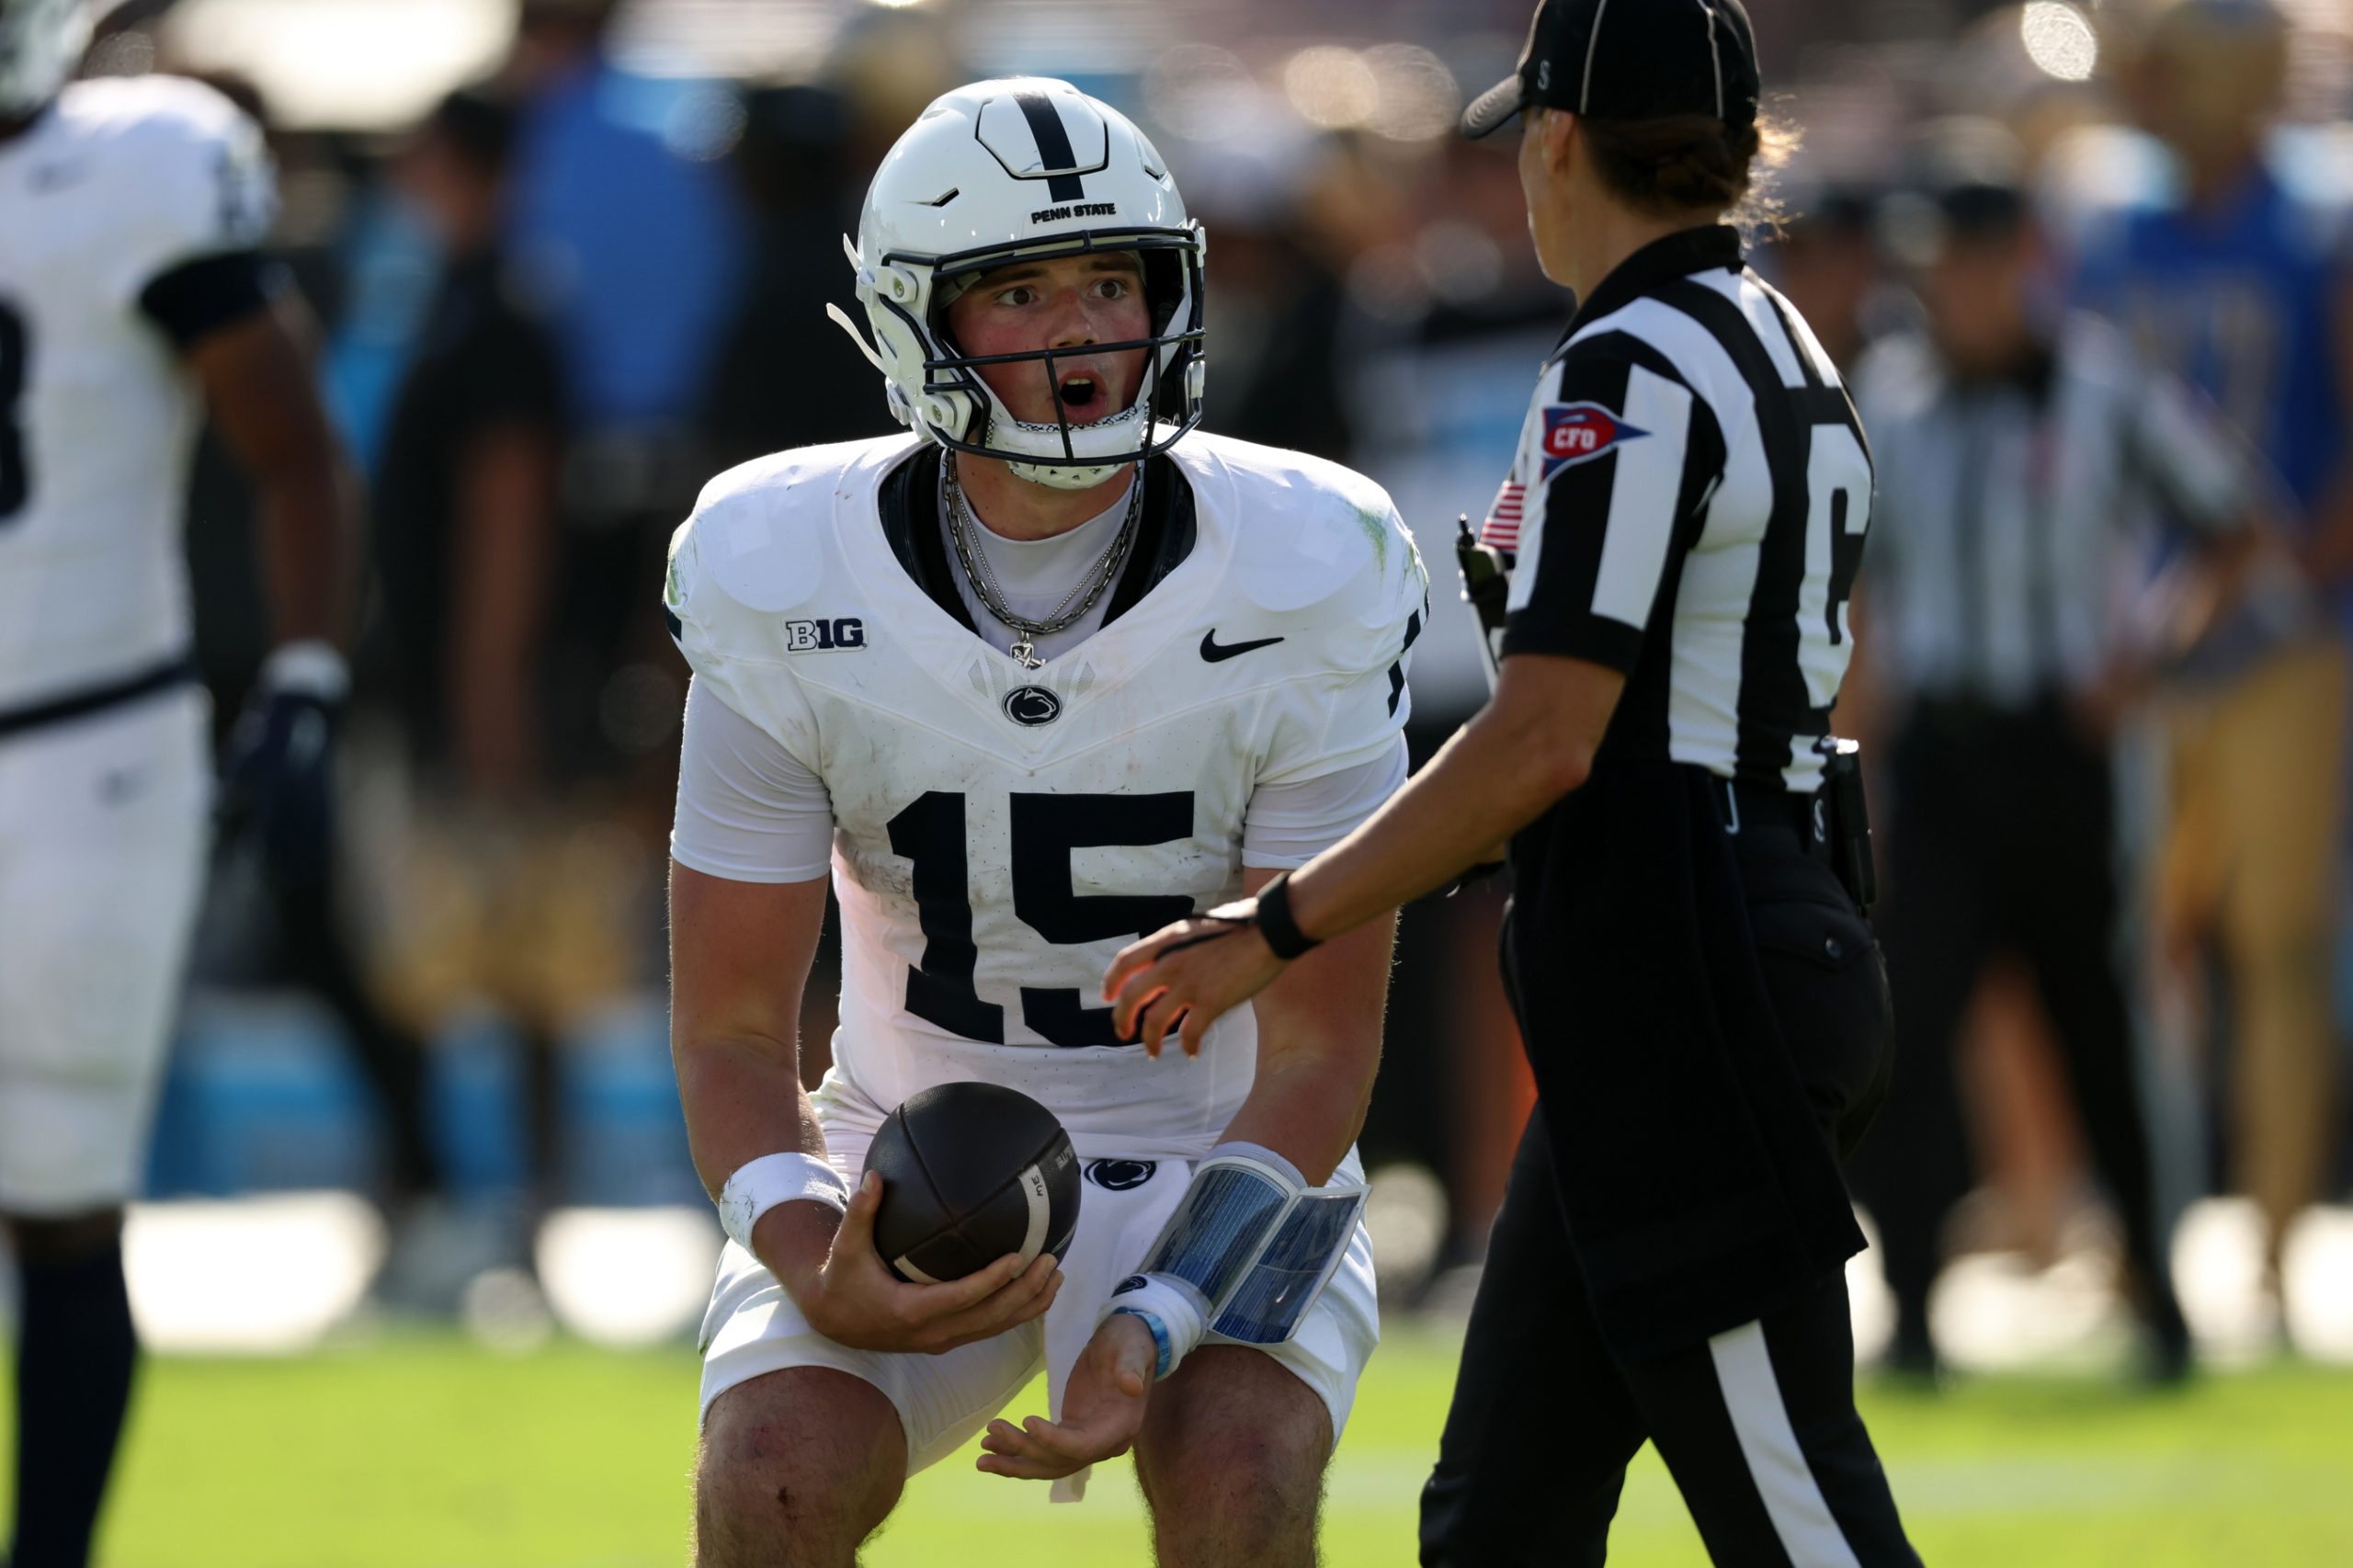
Penn State and Texas Go Down: How This Affects Their Championship Odds/AP Polling
- COLLEGE-FOOTBALL JAN 19, 2026
College Football Playoff Championship Game Odds: Lines, Spreads, Betting Trends for Miami vs. Indiana
- COLLEGE-FOOTBALL JAN 16, 2026
National Championship Prediction, Odds: Stats Back First-Half Under