MLB Hot & Not Report – World Series Best Bets
World Series Forecast...It's an Arms Race!!!
The slow pace of the overall sports betting market during the MLB All-Star break is something I appreciate more and more with each passing year. There will be weeks during the football season that bettors hope to have 3+ solid slow days working like they get right now so enjoy it while it's here.
It doesn't mean we can't take a peek at some MLB futures odds and see if there are some signs on who the contenders really are.
All-Star breaks typically come with teams 80-plus games into their season and with that kind of data the teams already are who they are so to speak. And with the emphasis on trying to obtain one of the three true outcomes beneficial to the team at the time (strikeout, walk, HR), teams that have figured out at least a few things from a pitching perspective by this point of the year tend to be the last ones standing in recent years.
For example, the simple concept of asking pitchers to try and give up as few hits as possible will always help the chances of winning a game. Counting last year's 2020 stats after the full 60-game regular season (as to get a similar sample size to past All-Star date numbers), four of the last five teams who came into the All-Star break ranked first in Hits per 9 (H/9) went on to play in the World Series, and three of the four won (2016 Cubs, 2017 Astros, 2020 Dodgers).
It's the 2021 Los Angeles Dodgers who rank first in that category again this year at the All-Star break, but at 7.04 and Milwaukee sitting at 7.06, those two pitching staffs have really separated themselves from the rest (San Francisco is 3 rd at 7.33).
That's not the only pitching stat taken at this time of year that gives off nice clues to what October will bring, but it's where we will start. There are a few numbers across the board that have led to getting the World Series matchups that we do, and at least for this 2021 season, Betting on the National League to win the World Series regardless of who it is may be something we all should consider.
MLB Betting Resources

MLB All-Star Break - Team Pitching Stats & Rankings
Since shifting to the true outcome approach, it would make sense to look for teams from a pitching standpoint that have proven they are among the best at limiting HR's against (HR per 9) and maximizing their strikeouts relative to their walks (K's per Walk) as well.
So here we've got a chart at where each eventual World Series participant (since 2007) ranked in those three pitching categories during the All-Star break and try to determine if we can draw some parallels to any of this year's teams in similar spots.
Pitching Categories to Watch
- Team K's per Walk (Pitching)
- HR per 9 (pitching)
- Team Hits Per 9 (Pitching)
| World Series Winner - Pitching Rankings | |||||||||||||||||||||||||||||||||||||||||||||||||||||||||||||||||||||||||||
|
For starter's there has been a clear shift since the 2016 Chicago Cubs title towards teams at the top end of these categories are the ones that make it to the end. Four of the five top ranked teams in H/9 have gone on to play in the World Series, but there also hasn't been a team that ranked worse than 12th in that category at the All-Star break make it the past six seasons.
2021 MLB Hits Per 9 Rankings
- L.A. Dodgers (7.04)
- Milwaukee (7.06)
- San Francisco (7.33)
- N.Y. Mets (7.4)
- Houston (7.42)
- Tampa Bay (7.46)
- San Diego (7.56)
- Miami (7.6)
- N.Y. Yankees (7.64)
- Chicago Sox (7.74)
- St. Louis (7.79)
- Chicago Cubs (7.95)
- Cleveland (8)
- Toronto (8.05)
- Washington (8.07)
- Cincinnati (8.11)
- Seattle (8.27)
- Oakland (8.33)
- Atlanta (8.34)
- Pittsburgh (8.5)
- LA Angels (8.5)
- Philadelphia (8.52)
- Colorado (8.72)
- Detroit (8.79)
- Texas (8.89)
- Boston (9.01)
- Minnesota (9.1)
- Kansas City (9.15)
- Baltimore (9.6)
- Arizona (9.76)
That's horrible news for Boston Red Sox fans this year, as despite outperforming all expectations by a mile so far, they rank 26th in H/9 right now, well beyond that 12th spot. There is also a good chunk of teams in the Wildcard picture right now (in both leagues) outside that threshold, so it might not matter all that much which teams of that bunch they end up being.
On the good side of that history in the H/9 category this year we've got the Los Angeles Dodgers as mentioned, but what really sticks out is that eight of the Top 12 teams come from the National League, including each of the Top 4, and six of the Top 8.

Kevin Gausman has been lights out this season for the San Francisco Giants and the team is expected to be a serious playoff contender. (AP)
There is no chance the St. Louis Cardinals and Chicago Cubs make the playoffs even if both go on all-time runs, but is anyone in a hurry to go against the pitching of the Dodgers, Brewers, Giants, or Mets right now? Finding a prop on the NL over the AL in the World Series would be the best way to go about backing that group at the moment, because when things get cold in October, it never hurts to have pitching to rely upon.
For the trend to hold true (no team worse than 12th makes WS), the American League opponent would be either Houston, Tampa Bay, New York or Chicago, even with all of them having some issues of varying degrees in recent weeks. As someone who's on the All-New York World Series prediction this year I'm glad to see both teams sitting inside the number so to speak.
Home Runs Per 9 (HR/9) Rankings
Keeping the ball in the ballpark has to fit the profile of a winning team in today's game where so many guys are just gearing up to hunt for the long ball. It hasn't been as consistent in predicting a future World Series team at this point in the year – the 2019 Houston Astros were 25th – but seven of the last eight World Series teams did rank 10th or better in this category at the All-Star break.
HR per 9 (pitching) Rankings
- Miami (0.83)
- St. Louis (0.89)
- San Francisco (0.99)
- Boston (1.04)
- Milwaukee (1.06)
- N.Y. Mets (1.06)
- L.A. Dodgers (1.1)
- Oakland (1.11)
- San Diego (1.12)
- Tampa Bay (1.12)
- Seattle (1.15)
- Chicago Sox (1.15)
- Houston (1.15)
- Colorado (1.19)
- N.Y. Yankees (1.19)
- Atlanta (1.21)
- Cincinnati (1.23)
- Pittsburgh (1.27)
- L.A. Angels (1.28)
- Philadelphia (1.31)
- Detroit (1.33)
- Chicago Cubs (1.33)
- Cleveland (1.35)
- Washington (1.36)
- Kansas City (1.36)
- Texas (1.37)
- Toronto (1.4)
- Arizona (1.52)
- Minnesota (1.55)
- Baltimore (1.59)
Being in that Top 10 range keeps all four of those NL teams ranking 1-4 in H/9 alive here as well, with the Giants (3rd), Brewers (5th), Mets (6th) and Dodgers (7th), strengthening the case for the National League again.
San Diego is another NL team that's been on the right side of both historical ranges this year (7th in H/9, 9th in HR/9), as are the St Louis Cardinals and Miami Marlins (8th in H/9, 1st in HR/9), who likely aren't going to make the playoffs, but if the Marlins can maintain these kind of pitching numbers, they may end up being one of the better “bet on” teams in the second half.
More confusion is all this historical trend brings on the American League side, as Boston (4th), and Oakland (8th) are back in the mix, with the White Sox (11th), Astros (11th), and Yankees (14th) all just out on the outside looking in.
It's the defending AL Champions from Tampa Bay that are the only AL team that has yet to get a strike against them in these two pitching categories, but with a recent slump highlighting the potential issues they can have offensively, asking the Rays to try and out-pitch the more talented team in another World Series is a tough idea to believe in at the moment.
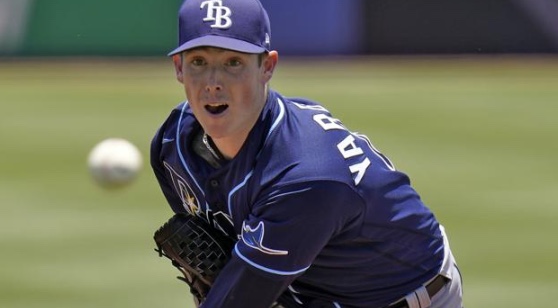
The Tampa Bay Rays are looking to get back in to the World Series, but find themselves in a tight AL East race. (AP)
Strikeouts per walk (K/BB)
A direct ratio between the positive defensive true outcome (strikeout) and positive offensive true outcome (walk) was the next place I wanted to look, and it's been nothing but Top 10 ranked teams in this category since that 2016 Chicago/Cleveland World Series. Oddly enough, the top ranked team has never made it during that stretch or even going back to 2007.
If I ever needed those doubts on Tampa Bay making it back to the World Series to be confirmed, the Rays ranking tops in K/BB at the All-Star break this year would have to be that evidence.
Strikeouts per walk (pitching) Rankings
- Tampa Bay (3.43)
- L.A. Dodgers (3.36)
- San Francisco (3.33)
- N.Y. Yankees (3.32)
- Chicago Sox (3.29)
- N.Y. Mets (3.15)
- San Diego (3.06)
- Oakland (3.04)
- Philadelphia (3)
- Toronto (2.95)
- Milwaukee (2.9)
- Miami (2.86)
- Boston (2.73)
- Houston (2.72)
- Minnesota (2.72)
- Washington (2.69)
- Texas (2.68)
- Atlanta (2.63)
- Cleveland (2.61)
- Seattle (2.56)
- L.A. Angels (2.36)
- Cincinnati (2.34)
- Baltimore (2.34)
- Chicago Cubs (2.32)
- Pittsburgh (2.25)
- Detroit (2.25)
- Arizona (2.24)
- Colorado (2.22)
- Kansas City (2.18)
- St. Louis (1.77)
The Dodgers, Giants, Mets, and Padres are the National League teams that remain within all three stat ranges, as Milwaukee's just outside at 11th in this category. Again, hard not to like the prospects of basically all of those teams should they be the NL representative in the World Series, and even if you struggle to believe the Giants are going to stay around in the 2nd half (and I do), being as highly ranked as they are in these pitching numbers suggests otherwise.
In the American League its Tampa's staff leading the league as mentioned, with the Yankees (4th), White Sox (5th), A's (8th), and Blue Jays (10th) sneaking inside the number. Puts more positives on a Yankees team that probably needs all that they can get right now after taking some deserved criticism in recent weeks, but it's another piece of evidence to support the potential for a wide-open AL playoff run.
Summary & Predictions
Finally, if you were to add up all the rankings of all the past World Series participants in these three pitching categories to get a “score to par” so to speak, you get some interesting results if the idea is to narrow down the field even further.
Ranking + Ranking + Ranking Score
How to read the 3-Ranking Score: Looking above at the first chart, the 2019 Washington Nationals ranked 6th in K/BB, 3rd in HR/9 and 12th in H/9 which would be a score of 21 (6+3+12).
- San Francisco (9)
- L.A. Dodgers (10)
- N.Y. Mets (15)
- Tampa Bay (16)
- Milwaukee (18)
- Miami (21)
- San Diego (23)
- Chicago Sox (26)
- N.Y. Yankees (27)
- Houston (30)
- Oakland (34)
- Boston (43)
- St. Louis (43)
- Seattle (48)
- Philadelphia (51)
- Toronto (51)
- Atlanta (53)
- Cincinnati (55)
- Cleveland (55)
- Washington (55
- Chicago Cubs (57)
- L.A. Angels (60)
- Pittsburgh (63)
- Colorado (65)
- Texas (68)
- Detroit (70)
- Minnesota (70)
- Baltimore (81)
- Kansas City (81)
- Arizona (85)
Make a note that no MLB team has ever made the World Series since 2016 with a score higher than “28” at the All-Star break in these three categories, and no World Series Champion has been higher than “21” in that same span. Both of those benchmark values came from that 2019 World Series that saw Washington win in seven games.
But this year, the range of 28 or lower narrowly keeps the Yankees and White Sox alive, but the bigger story is that five of the six teams with a score of “21” or better come from the National League.
Miami's playoff hopes are dismal which narrows the range even further, as it's once again the Giants, Dodgers, Mets, and Rays as teams who continue to meet all the requirements.
Milwaukee's overall pitching staff puts them back in mix as well, but it's still just a decisive edge to the National League in general that the NL over AL prop for the World Series is something I'm going to make a point of searching for going forward.
2021 World Series Predictions & Props
World Series Winner
- Los Angeles Dodgers +375
- Milwaukee Brewers +1300
- Tampa Bay Rays +1400
World Series Matchup
- Rays vs. Dodgers +2000
- White Sox vs. Brewers +3500
- Yankees vs. Mets +6600
Odds Subject to Change - Available at BetMGM

Daily Newsletter - Sign Up Today!
Mlb News
-
 MLB MAR 12, 2026
World Baseball Classic Odds: Prediction Market Moves for the 2026 Championship
- MLB MAR 16, 2026
2026 Fantasy Baseball Fade List: 5 High-ADP Hitters to Avoid
- MLB MAR 5, 2026
2026 Fantasy Baseball Sleepers: 5 Starting Pitchers to Roster
- MLB JAN 27, 2026
Who Will be on the Cover of MLB The Show 26? MLB The Show Cover Odds
- MLB JAN 13, 2026
MLB Best Ball: Your Guide To Baseball Best Ball on Underdog
- MLB JAN 16, 2026
Kyle Tucker Next Team Odds: Dodgers Sign Star Outfielder