The Most Dominant Nations at the 2026 Winter Games
A data-driven breakdown of who truly owned the podium — overall, per capita, and per athlete.
The 2026 Winter Games are complete. All 116 events have been decided. The medal table is final.
But total medals don’t tell the full story.
Larger nations send larger teams. More athletes mean more opportunities to win. So instead of relying on one scoreboard, Vegas Insider analyzed the final standings three different ways to measure true dominance:
- Total Medals — the traditional podium count
- Medals Per Capita — performance adjusted for population
- Medals Per 100 Athletes — how much each team got out of the roster it sent
One metric rewards size.
One rewards depth.
One rewards how well a team used its chances.
In betting terms, it’s the difference between volume and return.
Here’s how the world really stacked up.
Key Findings
- Norway topped the medal table with 41 medals (18 gold), delivering the most complete performance of the Games across cross-country skiing and biathlon.
- The United States finished second with 33 medals, powered by alpine skiing, snowboarding, and freestyle events.
- Italy’s 10 gold medals were the most by any European nation, pushing it to third overall.
- Once population is factored in, Norway’s dominance becomes historic, producing roughly 7.5 medals per million residents.
- The Netherlands emerges as the most efficient team overall, turning 39 athletes into 20 medals — the highest medals-per-athlete rate of the Games.
- New Zealand quietly posted one of the strongest efficiency marks, earning 3 medals from just 17 athletes.
- Scale reshuffles the story: when team size and population are removed from the equation, smaller nations climb the rankings.
Sports fans can use our FanDuel promo code

Total Medal Leaders — Classic Dominance
When the final event concluded, one nation stood clearly above the rest.
#1 Norway — 41 Total Medals
18 Gold | 12 Silver | 11 Bronze
Norway didn’t just lead — it controlled the Games. Its athletes consistently reached podiums in endurance-heavy snow disciplines, building an eight-medal cushion over the United States.
#2 United States — 33 Total Medals
12 Gold | 12 Silver | 9 Bronze
The U.S. matched Norway in silver medals and delivered marquee finals in alpine skiing and freestyle events, but lacked the same across-the-board depth.
#3 Italy — 30 Total Medals
10 Gold | 6 Silver | 14 Bronze
Italy paired volume with top-end impact. Its 10 gold medals were the strongest gold return in Europe.
#4 Germany — 26 Total Medals
8 Gold | 10 Silver | 8 Bronze
Germany’s consistency in sliding sports and biathlon kept it firmly inside the top tier.
#5 Japan — 24 Total Medals
5 Gold | 7 Silver | 12 Bronze
Japan leaned heavily on skating and snowboard disciplines, reaching the podium frequently even when gold conversion lagged.
#6 France — 23 Total Medals
8 Gold | 9 Silver | 6 Bronze
France’s eight gold medals kept it competitive at the top despite finishing sixth in total count.
Medals Per Capita — Population-Adjusted Dominance
Total medals reward size. Per-capita rankings reward national depth.
When population is factored in, the gap between global giants and winter specialists becomes clearer.
#1 Norway — 41 Medals
Population: ~5.5 million
~7.5 medals per million residents
No country came close. Norway produced roughly one medal for every 133,000 residents.
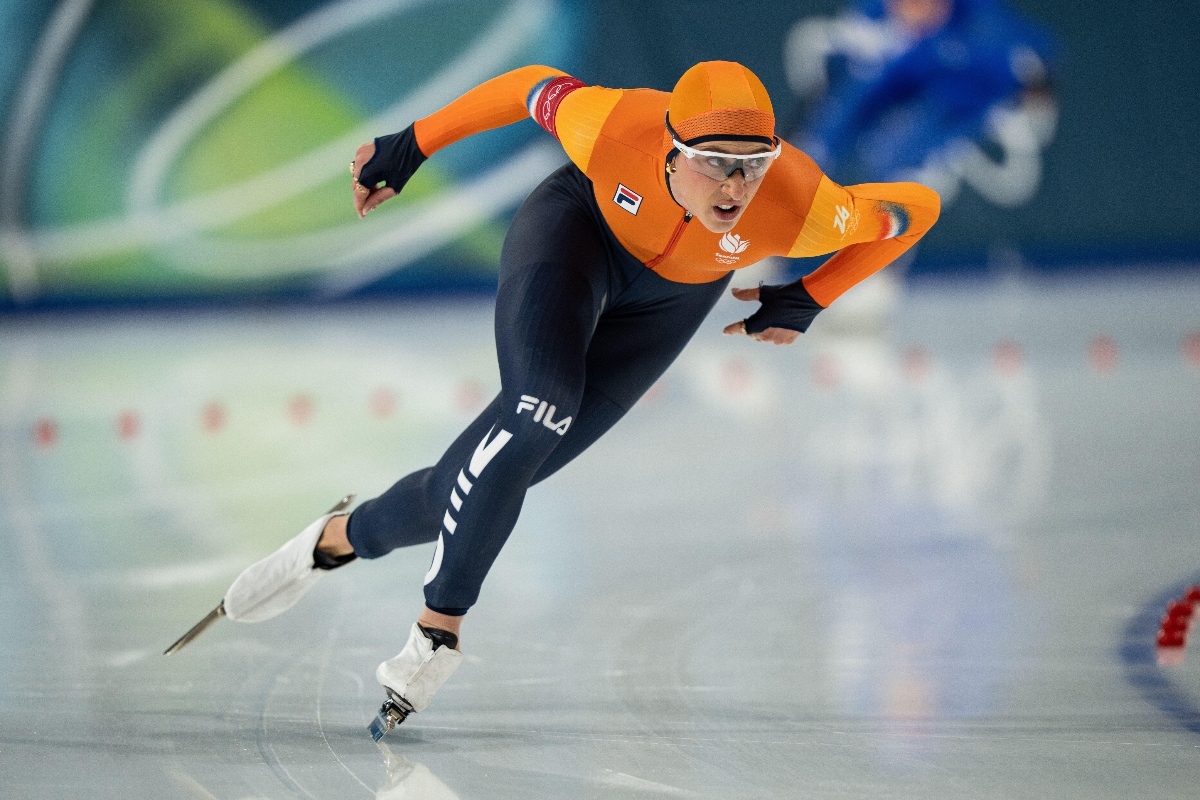
#2 Netherlands — 20 Medals
Population: ~17.8 million
A mid-sized nation that consistently punches above its weight, driven largely by speed skating.
#3 Austria — 18 Medals
Population: ~9.1 million
Austria’s alpine infrastructure continues to translate into podium success.
#4 Slovenia — 4 Medals
Population: ~2.1 million
A small nation with targeted strengths that show up more clearly when adjusted for size.
#5 Switzerland — 23 Medals
Population: ~8.8 million
Depth across alpine events keeps Switzerland near the top when scaled to population.
Medals Per 100 Athletes — Which Teams Got the Most Out of Their Roster
Total medals measure output.
Medals per 100 athletes measure how much a team did with the athletes it brought.
#1 Netherlands — 51.28 Medals per 100 Athletes
20 Medals | 39 Athletes
The Netherlands sent one of the smallest delegations among major medal nations — and still converted more than half a medal per athlete.
#2 Norway — 51.25 Medals per 100 Athletes
41 Medals | 80 Athletes
Even with a larger team, Norway nearly matched the Netherlands on output per athlete.
#3 Japan — 19.83 Medals per 100 Athletes
24 Medals | 121 Athletes
A strong return driven by skating and snowboard depth.
#4 New Zealand — 17.65 Medals per 100 Athletes
3 Medals | 17 Athletes
A small delegation, high impact.
#5 Sweden — 16.36 Medals per 100 Athletes
18 Medals | 110 Athletes
Steady podium finishes across disciplines.
Expert Comment
“Norway owned the medal table, but what makes this Games interesting is how the picture changes when you adjust for size. Norway dominates raw totals and per capita rankings. The Netherlands leads when you measure what teams did with the athletes they brought. It shows there isn’t just one definition of dominance.”
— Vegas Insider Analyst
Redefining Dominance
The final medal table shows Norway on top with 41 medals.
But when the numbers are adjusted:
- Norway becomes even more impressive per capita.
- The Netherlands rises to the top per athlete.
- Smaller nations become more competitive when scale is removed.
Taken together, the data reveals three versions of success:
Volume. Depth. Return.
And at the 2026 Winter Games, Norway was the only nation that ranked at or near the top across all three.
In sport — as in betting — opportunity creates the chance. Execution defines the outcome.
Methodology
This analysis uses final official medal results from the 2026 Winter Games (116 of 116 events completed).
Metrics calculated:
- Total Medals: Official final medal count.
- Medals Per Capita: Total medals divided by national population (latest World Bank data), expressed per million residents.
- Medals Per 100 Athletes: Total medals divided by official delegation size, expressed per 100 athletes.
Only nations with at least one medal were included in efficiency rankings.
All calculations use publicly available data standardized across countries.
Sources
- Official 2026 medal table
- Official National Olympic Committee delegation rosters
- World Bank population data
- Internal analysis by Vegas Insider
Sportsbook Offers
Explore the latest:
- DraftKings Promo Code
https://www.vegasinsider.com/sportsbooks/draftkings/promo/ - Best Sportsbook Promos
https://www.vegasinsider.com/sportsbooks/bonus-codes/
Full Dataset
Open the complete data table here.