America’s Most and Least Overcrowded Casino Hotspots

As casino tourism continues to surge across the U.S., millions of visitors are flocking to gaming destinations — especially during peak seasons. While the lights, entertainment, and high-stakes action are part of the draw, many casino-goers are surprised by just how crowded these venues can get.
To help travelers plan smarter, data experts at VegasInsider developed the Casino Crowding Index (0–100) — a ranking that highlights where casinos are most likely to feel overcrowded. The index takes into account the number of casinos in each destination, the volume of tourist visits, and the local population base, balancing these factors to reveal which states face the greatest pressure on their casino floors.
The full methodology and data sources used in this analysis can be found below.
The goal is simple: to help visitors know what to expect before they go — whether that means finding a destination with more breathing room or bracing for heavier crowds at the busiest hubs.
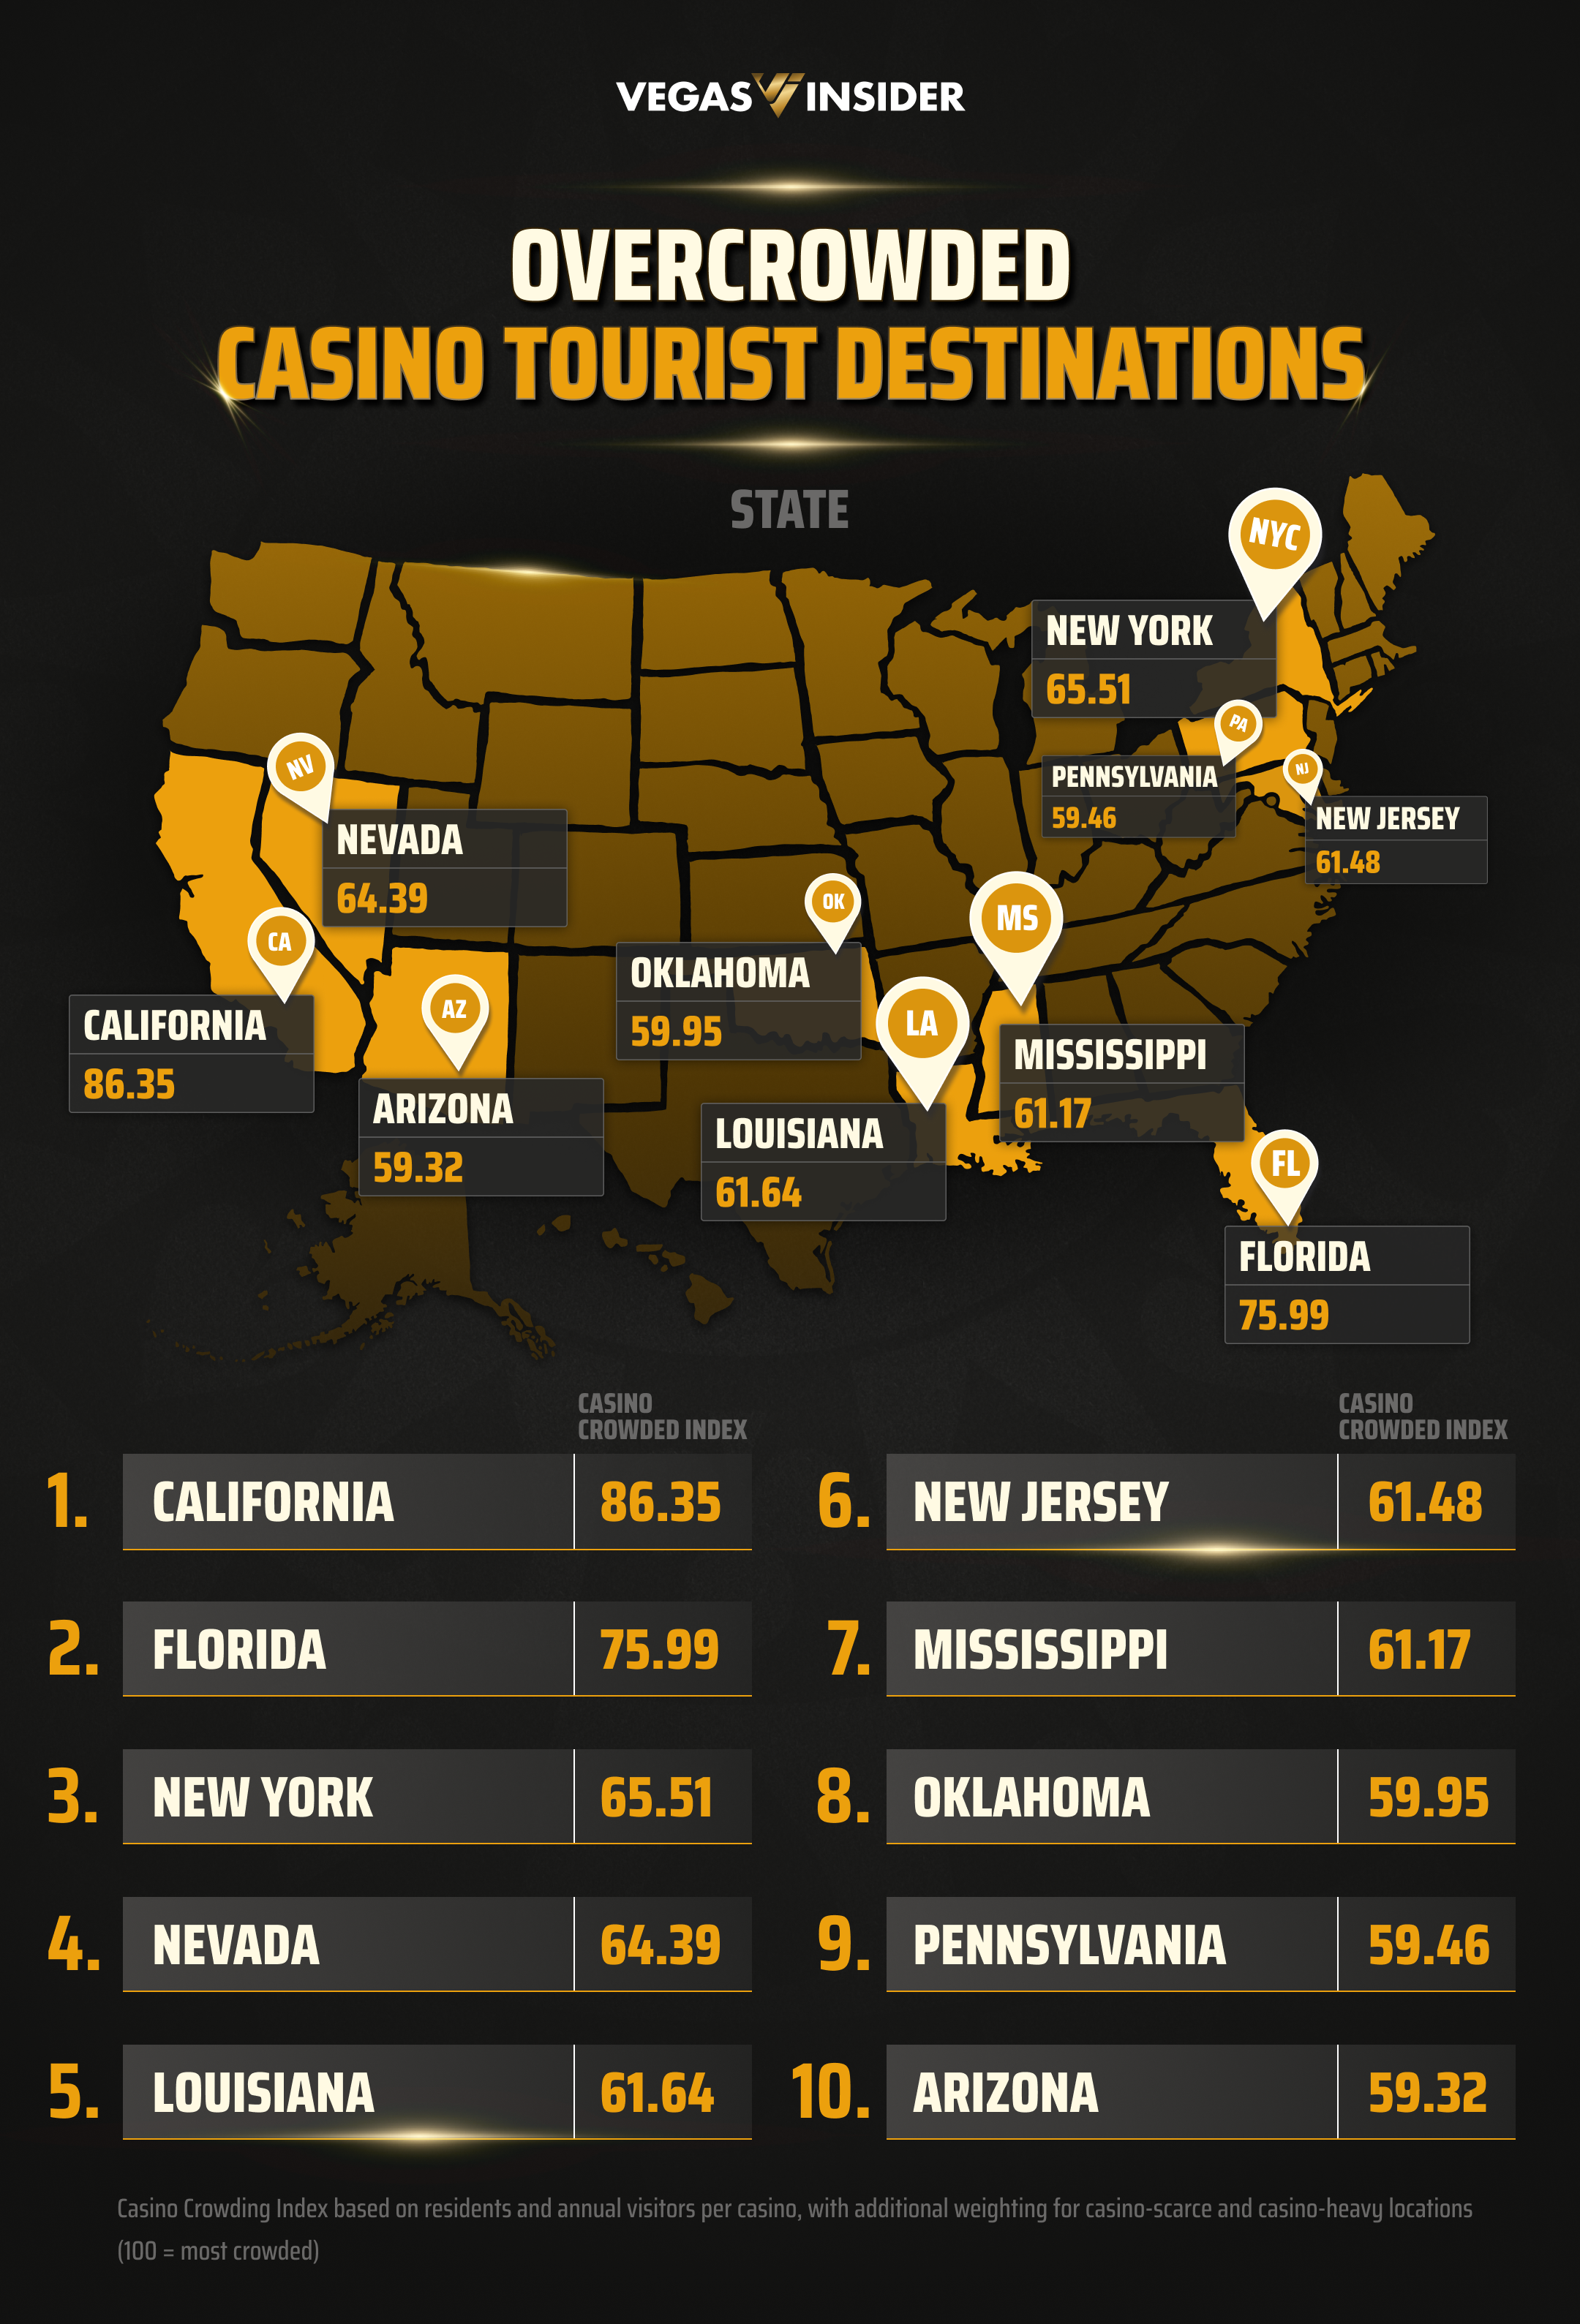
The States Where Casinos Are Most Likely to Get Overcrowded
When it comes to casino tourism, not all states handle the pressure equally. Some destinations may have enough casinos to spread out demand, while others — even with a large number of venues — still struggle to keep up with heavy tourist inflows, especially during peak seasons.
Our State-Level Casino Crowding Index (0–100) highlights where players are most likely to encounter crowded casino floors — whether driven by massive tourist demand, large resident populations, or simply too few casinos to absorb the traffic.
Below is the full breakdown of the top 10 states most likely to face overcrowding in their casinos, particularly during peak travel seasons.
Key Takeaways from the Most Crowded States
California (Rank #1 — Casino Crowding Index: 86.35/100)
California’s 164 casinos may sound like a lot, but each one still handles around 1.75 million tourist visits annually. With a per-casino traffic score of 89.12/100 and a statewide traffic score of 83.58/100, the Golden State tops the Casino Crowding Index
Florida (Rank #2 — Casino Crowding Index: 75.99/100)
Florida’s 78 casinos face some of the heaviest inflows in the country, with each venue averaging close to 2 million tourist visits per year. A per-casino traffic score of 78.51/100 and a statewide traffic score of 73.47/100 cement its second-place ranking.
New York (Rank #3 — Casino Crowding Index: 65.51/100)
With just 41 casinos, New York absorbs more than 7.7 million tourist visits per venue annually — the heaviest load in the top 10. This results in a per-casino traffic score of 67.58/100 and a statewide traffic score of 63.44/100, securing third place.
Nevada (Rank #4 — Casino Crowding Index: 64.39/100)
Even with 410 casinos, Nevada’s reputation as the world’s gaming capital keeps demand high. Each casino sees roughly 139,000 tourist visits annually, producing a per-casino traffic score of 61.91/100 and a statewide traffic score of 66.86/100.
Louisiana (Rank #5 — Casino Crowding Index: 61.64/100)
Louisiana’s 53 casinos each attract nearly 885,000 tourist visits per year. A per-casino traffic score of 62.61/100 and a statewide traffic score of 60.68/100 keep it firmly in the top five most crowded states.
Beyond the top five, states such as New Jersey (61.48), Mississippi (61.17), Oklahoma (59.95), Pennsylvania (59.46), and Arizona (59.32) also appear in the top 10 — each recording millions of tourist visits per casino annually and ranking well above the national average for crowding.
The States With the Least Crowded Casinos
Not every casino destination is packed wall-to-wall with visitors. While some states struggle to keep up with tourist demand, others benefit from having more venues relative to the number of visitors they attract. In these places, casino-goers are more likely to find open tables, shorter lines, and less competition for space — even during peak travel seasons.
It’s also worth noting that some destinations, although they see massive overall tourist traffic, only have a fraction of those visitors actually step inside casinos — meaning the pressure on gaming floors isn’t as intense as the headline numbers might suggest.
Here’s the list of the 10 states where casinos offer the most space and the least crowding for visitors.
Key Takeaways from the Least Crowded States
Alabama (Rank #40 — Casino Crowding Index: 18.15/100)
With only 8 casinos across the state, Alabama sees around 395,000 tourist visits per casino annually — relatively light traffic by national standards. A per-casino traffic score of 15.75/100 and a statewide traffic score of 20.55/100 make it the least crowded casino destination in America.
Alaska (Rank #39 — Casino Crowding Index: 19.42/100)
Alaska’s 12 casinos welcome just 300,000 tourist visits per venue each year on average. With a per-casino traffic score of 16.45/100 and a statewide traffic score of 22.39/100, the state offers one of the most laid-back casino experiences in the country.
New Hampshire (Rank #38 — Casino Crowding Index: 24.99/100)
Despite having 17 casinos, New Hampshire casinos see only about 289,000 tourist visits per venue annually. A per-casino traffic score of 22.26/100 and a statewide traffic score of 27.73/100 reflect just how calm and uncrowded the Granite State’s casino floors are
Wyoming (Rank #37 — Casino Crowding Index: 26.81/100)
Wyoming’s 25 casinos spread demand exceptionally well, averaging just 231,000 tourist visits per casino each year. With a per-casino traffic score of 23.63/100 and a statewide traffic score of 29.98/100, the state offers players plenty of room to enjoy their games.
Kansas (Rank #36 — Casino Crowding Index: 34.00/100)
Kansas is home to 13 casinos, each welcoming about 3.18 million tourist visits annually. Even with that traffic, its per-casino traffic score of 33.21/100 and a statewide traffic score of 34.79/100 place it firmly among the least crowded destinations.
Beyond the top five least crowded states, several others also stand out for their relaxed casino environments: Idaho (35.67/100), Arkansas (36.87/100), Maryland (37.15/100), Virginia (37.28/100), Massachusetts (38.62/100), and Nebraska (39.27/100) all round out the bottom 10. While some states (like Arkansas and Massachusetts) see higher per-casino traffic, their modest overall casino counts keep conditions far more manageable compared to busier, casino-scarce destinations.
Find the complete state rankings below, from most to least likely to experience overcrowding.
The U.S. Cities Where Casinos Are Most Likely to Get Overcrowded
While state-level trends highlight the broader pressure on casino tourism, the experience can look very different once you zoom in at the city level. Some urban hubs concentrate millions of visitors into just a few casinos, while others have larger networks that spread demand more evenly. The result is a big difference in how crowded players can expect the gaming floors to feel.
Our City-Level Casino Crowding Index (0–100) identifies where visitors are most likely to face overcrowded conditions, based on a mix of tourist visits per casino, local populations, and the number of venues available.
Below is the breakdown of the 10 U.S. cities most likely to face overcrowding in their casinos, particularly during peak travel seasons.

Key Takeaways from the Most Crowded Cities
Las Vegas, Nevada (Rank #1 — Casino Crowding Index: 90.48/100)
Las Vegas tops the list with 195 casinos, each averaging 209,000 tourist visits per year. Despite its massive casino count, the nonstop influx of visitors pushes the city to a per-casino traffic score of 90.82/100 and a citywide score of 89.12/100 — the highest overall in the nation.
New York City, New York (Rank #2 — Casino Crowding Index: 80.93/100)
With just 9 casinos to serve one of the world’s busiest destinations, New York City casinos absorb nearly 6.9 million tourist visits per venue annually. A per-casino traffic score of 84.32/100 and a citywide score of 67.34/100 give the Big Apple the second-highest crowding index.
Los Angeles, California (Rank #3 — Casino Crowding Index: 79.13/100)
Los Angeles also has only 9 casinos, yet each one welcomes 5.4 million tourist visits annually on average. With a per-casino traffic score of 82.45/100 and a citywide score of 65.88/100, L.A. ranks third for overcrowded casinos.
Philadelphia, Pennsylvania (Rank #4 — Casino Crowding Index: 77.82/100)
Philadelphia’s 7 casinos each see over 6.1 million tourist visits per year, giving it one of the highest per-casino loads in the country. Its per-casino traffic score of 81.35/100 and a citywide score of 63.67/100 cement its place in the top five.
Atlantic City, New Jersey (Rank #5 — Casino Crowding Index: 77.63/100)
With 10 casinos and a long-standing reputation as a gambling hub, Atlantic City venues average 2 million tourist visits each year. A per-casino traffic score of 80.75/100 and a citywide score of 65.14/100 keep it firmly in the overcrowding top 10.
Beyond the top five, cities such as Miami (77.59/100), Detroit (77.23/100), New Orleans (75.22/100), Tampa (74.84/100), and Phoenix (72.53/100) also rank in the top 10. Each combines high tourist demand with limited capacity to absorb the traffic, making the likelihood of congested gaming floors especially high.
The U.S. Cities With the Lowest Risk of Casino Crowding
Not every casino city runs at full capacity. While some urban hubs draw overwhelming demand, others see far lighter traffic on their gaming floors. Whether it’s because of a higher number of venues, smaller visitor volumes, or populations that don’t overwhelm local casinos, these destinations give players room to move.
In these cities, casino-goers are far less likely to encounter packed tables or long waits, even during busier travel periods.
Here’s a breakdown of the 10 U.S. cities where casinos provide the most space and the least crowding for visitors.
Key Takeaways from the Least Crowded Cities
Wolf Point, Montana (Rank #78 — Casino Crowding Index: 23.45/100)
With only 3 casinos serving fewer than 3,000 residents, Wolf Point sees just 812 tourist visits per casino annually. Its per-casino traffic score of 25.37/100 and citywide score of 15.75/100 make it the least crowded casino city in the U.S.
Amite, Louisiana (Rank #77 — Casino Crowding Index: 27.03/100)
Amite’s 3 casinos each attract roughly 1,420 tourist visits annually — extremely light by national standards. A per-casino traffic score of 29.12/100 and a citywide score of 18.65/100 keep it near the very bottom of the index.
Livingston, Texas (Rank #76 — Casino Crowding Index: 29.41/100)
Home to 3 casinos, Livingston averages about 1,909 tourist visits per casino annually. With a per-casino traffic score of 31.62/100 and a citywide score of 20.58/100, it ranks among the calmest casino destinations nationwide.
Black Hawk, Colorado (Rank #75 — Casino Crowding Index: 36.35/100)
Despite hosting 16 casinos, Black Hawk casinos each average only 1,250 tourist visits annually. A per-casino traffic score of 36.98/100 and a citywide score of 33.85/100 place it among the most spacious casino environments in America.
Sidney, Montana (Rank #74 — Casino Crowding Index: 36.57/100)
With 4 casinos and just over 20,000 residents, Sidney sees around 3,875 tourist visits per casino annually. A per-casino traffic score of 38.78/100 and a citywide score of 27.69/100 keep it firmly in the bottom five.
Beyond the top five, cities such as Fallon (38.27/100), Anaconda (40.80/100), Elko (41.84/100), Harlem (43.00/100), and Vinton (43.49/100) also rank in the top 10. Each records relatively low tourist volumes per casino, keeping the likelihood of crowded gaming floors among the lowest in the country.
Find the complete city rankings below, from most to least likely to experience overcrowding.
Whether you’re drawn to the high-energy atmosphere of America’s busiest gaming hubs or prefer the calm of destinations where the odds of crowding are low, the Casino Crowding Index gives travelers a clearer picture of what to expect. From Nevada’s mega-resorts to small towns in Montana, casino experiences can vary dramatically — and knowing where each destination stands can help you plan the kind of trip you want.
And if you’d rather enjoy casino-style entertainment without worrying about travel or crowded floors, you can also explore our guides to the Best Sweepstakes Casinos and Best Online Casinos for fun from home.
How the Casino Crowding Index Was Built
To measure how crowded casinos are across U.S. states and cities, we created two traffic-based scores that combine into a single Casino Crowding Index (0–100):
1. Per-Casino Traffic Score (0–100) — Higher = more foot traffic per casino
This score shows how busy the average casino is in a given location.
Based on two factors: tourists per casino and residents per casino.
These figures were used to estimate daily traffic per casino.
Results were log-transformed and rescaled to a 0–100 index.
Scores were lightly adjusted depending on whether a location was casino-heavy (many casinos to spread demand) or casino-scarce (fewer casinos under greater pressure). Casino-heavy areas received slightly higher weighting, as casinos are central to the visitor experience.
2. Locationwide Casino Traffic Score (0–100) — Higher = greater statewide or citywide traffic
This score reflects the total annual casino footfall in a state or city.
Based on the combined volume of tourists and local residents visiting casinos.
Figures were log-transformed, normalized, and scaled to a 0–100 index.
3. Casino Crowding Index (0–100)
The final index combines both scores with equal weighting (50/50).
A higher score means casinos in that state or city are more likely to feel overcrowded.
Sources
Tourist Visits: 2023 visitor statistics from state tourism boards and official visitor reports, adjusted forward using the national average increase in tourism between 2023–2025
Population Data: U.S. Census Bureau, 2024 estimates.
Casino Counts: Publicly available data from World Casino Directory, World Population Review, and state gaming commissions.
Coverage: Analysis includes all U.S. states and cities with tribal or commercial casinos. Locations without physical casinos or where gambling is prohibited were excluded.