MAMDANI WINS: New York Mayoral Election Betting Odds
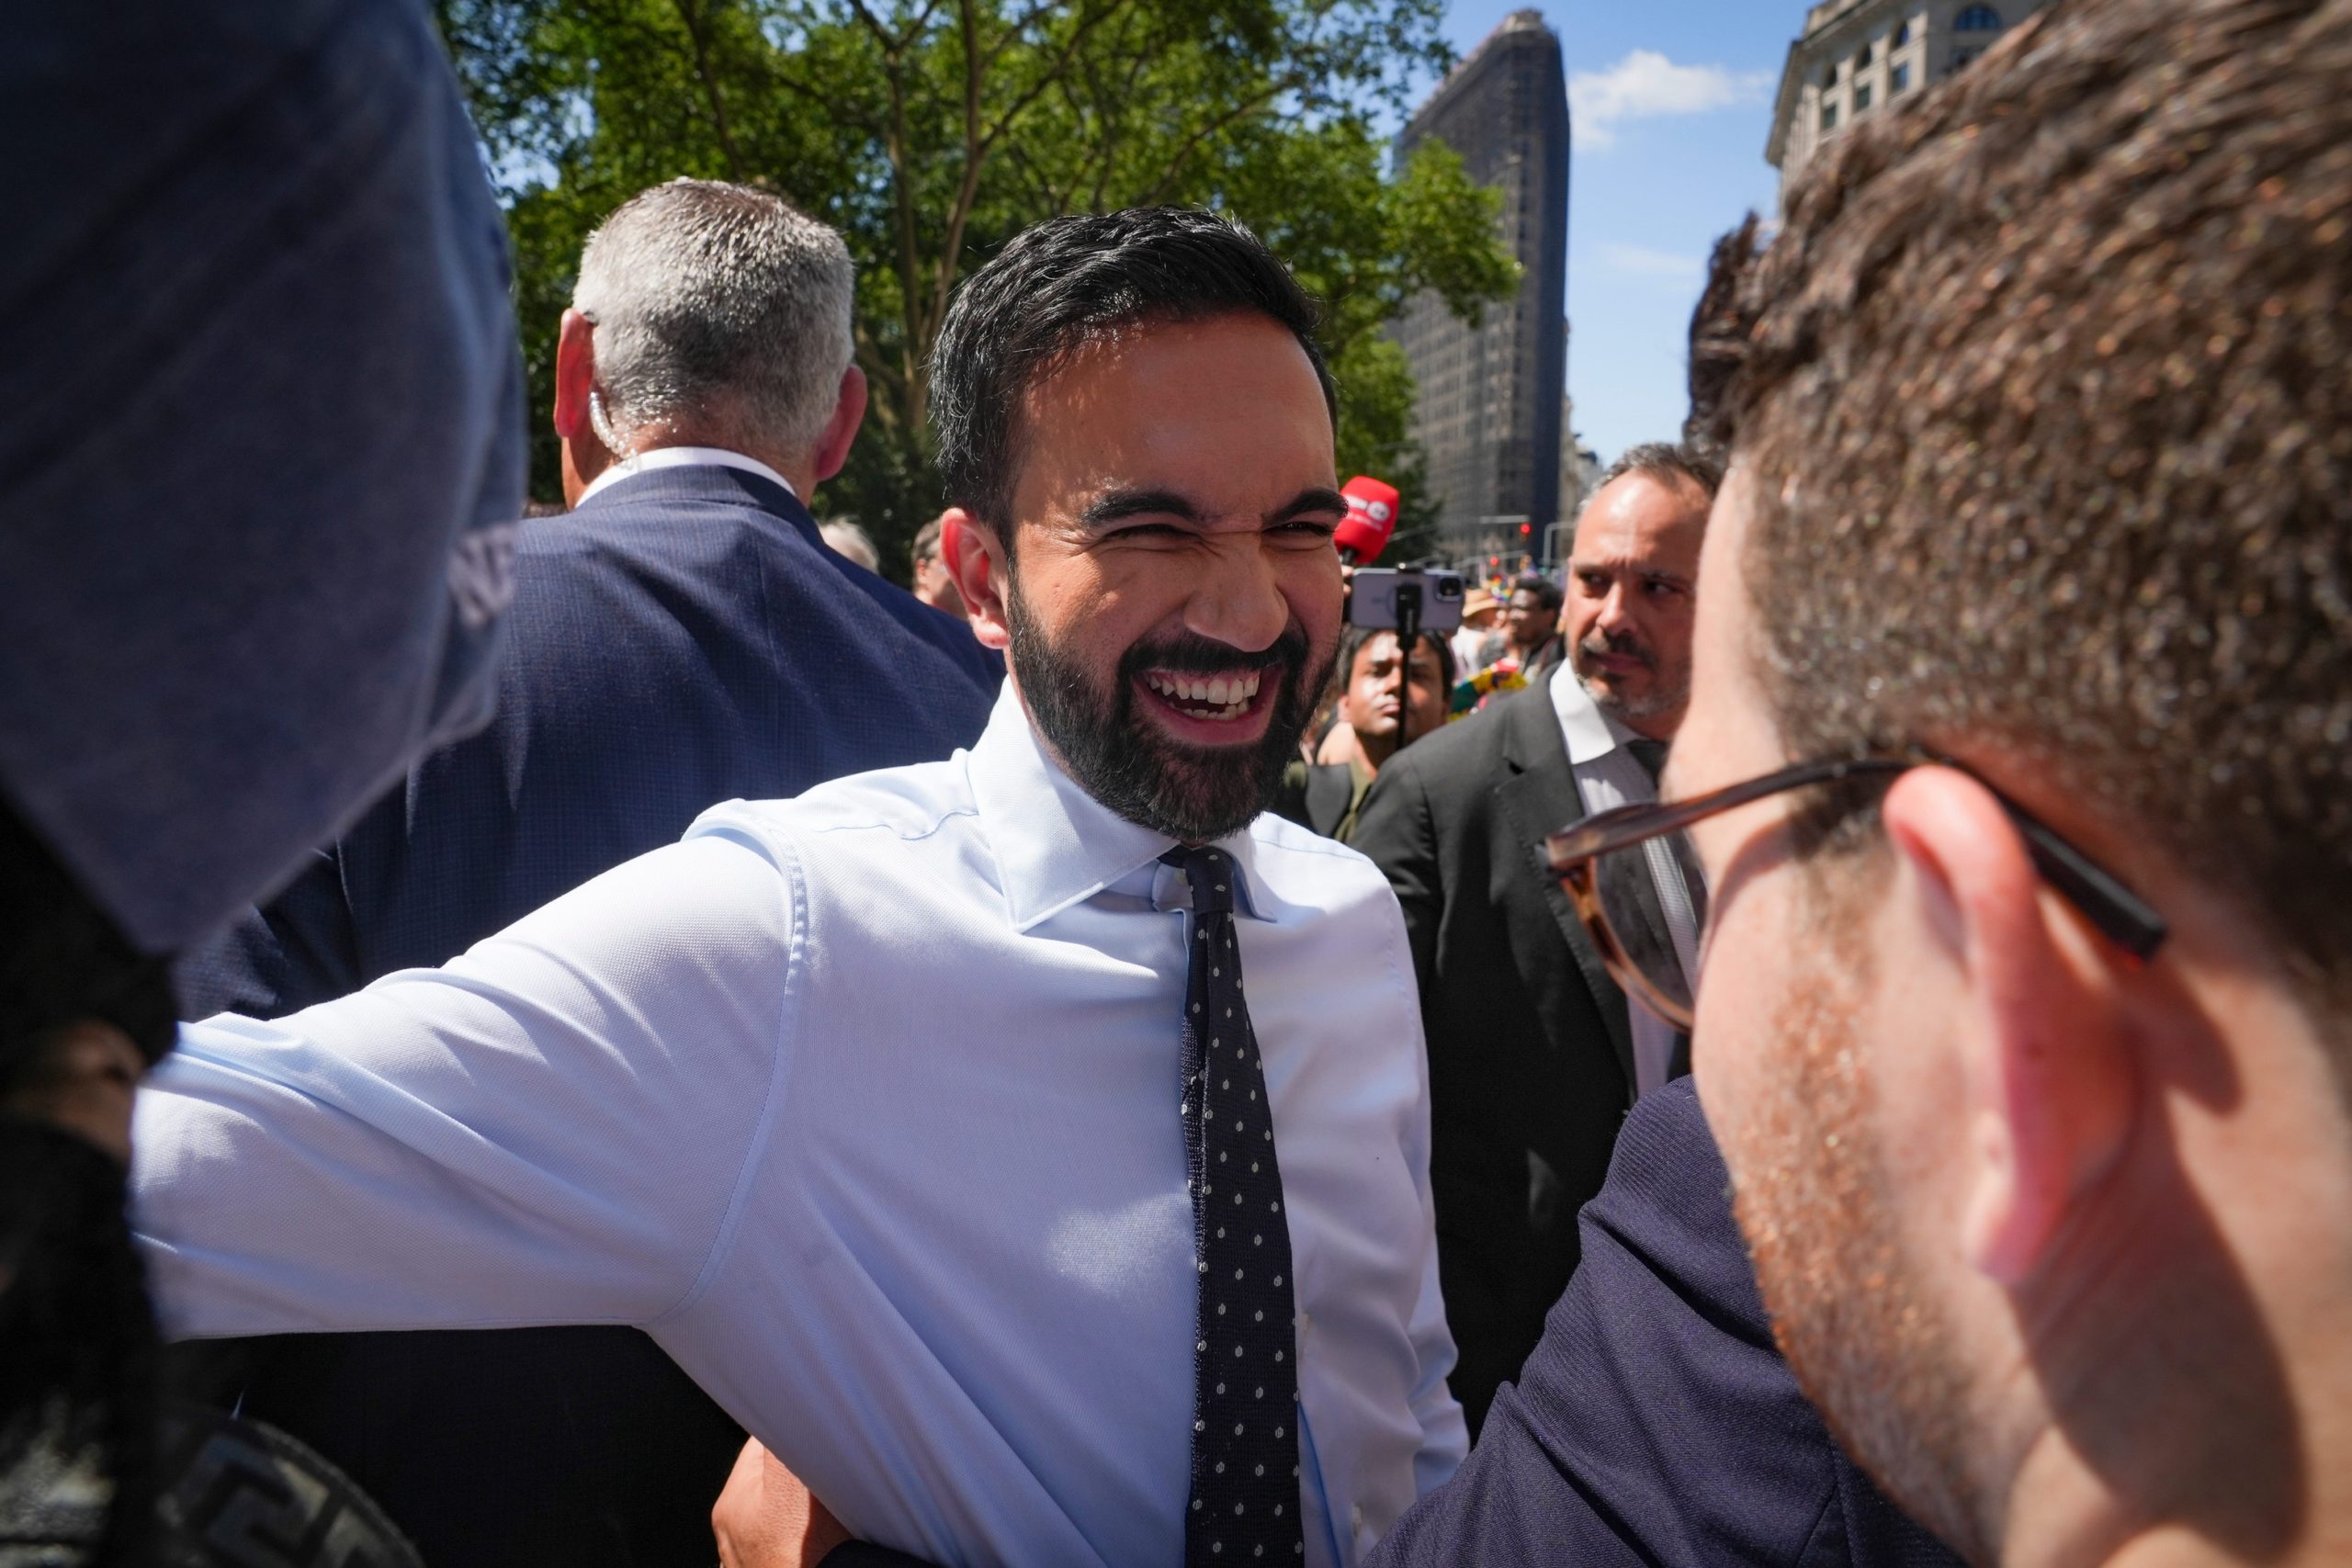
Image Credit: © Yannick Peterhans/NorthJersey.com / USA TODAY NETWORK via Imagn Images
November 4, 9:33 PM ET: MSNBC has called the New York City Mayoral Race for Democratic candidate Zohran Mamdani.
Today is election day, and the New York City Mayoral Race is one that has sparked conversation on both sides of the aisle. Follow along with us today as voting takes place to elect the new mayor of New York City.
Polls close in 15 minutes, and Kalshi has Mamdani's odds at a startling 95% chance of victory. We will now shortly who the winner will be.
The polls are currently closed and we will know who won the New York City Mayoral Race shortly.
Update as of November 4th, 8:44 PM ET:
- Mamdani's odds have remained stable, currently sitting at 95%.
- Cuomo's odds now sit at 6%, lower than the 13% he was at this morning.
- Silwa's implied probability of winning remains the same at 1%
The New York City mayoral race has officially moved from competitive to lopsided — and the betting markets are treating it as all but decided. While political polling suggests voter sentiment, betting odds show where money is actually being placed, giving insight into real-time sentiment among bettors, sportsbooks, and predictive markets.
Below, we break down the latest implied odds movement for the top candidates in the race: Zohran Mamdani, Andrew Cuomo, and Curtis Sliwa.
New York Mayoral Odds — Market Movement
Odds shown as implied probability of winning (%)
Key Takeaways
- Zohran Mamdani is now a prohibitive favorite, rising from a coin flip in June (54.5%) to a dominant 97.0% probability.
- Andrew Cuomo’s odds collapsed, dropping from 47.6% to single-digit longshot (8.8%).
- Curtis Sliwa remains a deep longshot, holding steady in the 1–3% range.
Despite high name recognition, Sliwa and Cuomo are not attracting betting momentum. Mamdani, however, has generated consistent inflows every month since June — a pattern sportsbooks typically equate with unavoidable inevitability.
You can place a wager on the upcoming NYC mayor race on platforms like Kalshi - check out this Kalshi referral code if you do!
How Accurate Are Betting Odds vs. Polls?
Odds vs. Polls – Presidential Elections (2008–2024)
We analyzed five past U.S. presidential races to compare which metric did a better job predicting the winner:
| Year | Winner | Winner Odds | Winner Poll (%) | Runner-up | Runner-up Odds | Runner-up Poll (%) | Odds Right | Polls Right | Both Right |
| 2024 | Donald Trump | -160 | 49 | Kamala Harris | 140 | 49 | ✅ Yes | ➖ Tie | ❌ No |
| 2020 | Joe Biden | -175 | 51 | Donald Trump | 150 | 44 | ✅ Yes | ✅ Yes | ✅ Yes |
| 2016 | Donald Trump | +375 | 42 | Hillary Clinton | -550 | 46 | ❌ No | ❌ No | ❌ No |
| 2012 | Barack Obama | -450 | 49 | Mitt Romney | 360 | 48 | ✅ Yes | ✅ Yes | ✅ Yes |
| 2008 | Barack Obama | -900 | 53 | John McCain | 800 | 42 | ✅ Yes | ✅ Yes | ✅ Yes |
| 2004 | George W. Bush | -140 | 49 | John Kerry | 120 | 49 | ✅ Yes | ➖ Tie | ❌ No |
| 2000 | George W. Bush | -150 | 48 | Al Gore | 110 | 46 | ✅ Yes | ✅ Yes | ✅ Yes |
| 1996 | Bill Clinton | -1000 | 52 | Bob Dole | 600 | 41 | ✅ Yes | ✅ Yes | ✅ Yes |
| 1992 | Bill Clinton | -800 | 49 | George H. W. Bush | 500 | 37 | ✅ Yes | ✅ Yes | ✅ Yes |
| 1988 | George H. W. Bush | -700 | 56 | Michael Dukakis | 400 | 44 | ✅ Yes | ✅ Yes | ✅ Yes |
| 1984 | Ronald Reagan | -700 | 59 | Walter Mondale | 450 | 41 | ✅ Yes | ✅ Yes | ✅ Yes |
| 1980 | Ronald Reagan | -180 | 47 | Jimmy Carter | 160 | 44 | ✅ Yes | ✅ Yes | ✅ Yes |
| 1976 | Jimmy Carter | +100 | 48 | Gerald Ford | -120 | 49 | ❌ No | ❌ No | ❌ No |
| 1972 | Richard Nixon | -10,000 | 62 | George McGovern | 5,000 | 38 | ✅ Yes | ✅ Yes | ✅ Yes |
| 1968 | Richard Nixon | -220 | 43 | Hubert Humphrey | 180 | 42 | ✅ Yes | ✅ Yes | ✅ Yes |
| 1964 | Lyndon Johnson | -3,300 | 64 | Barry Goldwater | 2,000 | 36 | ✅ Yes | ✅ Yes | ✅ Yes |
| 1960 | John Kennedy | +110 | 51 | Richard Nixon | -130 | 49 | ❌ No | ✅ Yes | ❌ No |
| 1956 | Dwight Eisenhower | -600 | 59 | Adlai Stevenson | 500 | 40 | ✅ Yes | ✅ Yes | ✅ Yes |
| 1952 | Dwight Eisenhower | -120 | 51 | Adlai Stevenson | -120 | 49 | ➖ Tie | ✅ Yes | ❌ No |
| 1948 | Harry Truman | +1500 | 45 | Thomas Dewey | -1800 | 50 | ❌ No | ❌ No | ❌ No |
| 1944 | Franklin Roosevelt | -340 | 51 | Thomas Dewey | 300 | 48 | ✅ Yes | ✅ Yes | ✅ Yes |
| 1940 | Franklin Roosevelt | -200 | 52 | Wendell Willkie | 200 | 48 | ✅ Yes | ✅ Yes | ✅ Yes |
| 1936 | Franklin Roosevelt | -250 | 56 | Alf Landon | 180 | 44 | ✅ Yes | ✅ Yes | ✅ Yes |
Results (Over Last Five Election Cycles):
- Odds correctly predicted 4 of the last 5 presidential winners (80%)
- Polling accuracy lagged at 60%
Betting markets adjust instantly as new information emerges — polling does not. In tight races, bettors move first; pollsters follow.
Bettors are often better forecasters than polls — because they have skin in the game.
When we apply that logic to New York City’s mayoral race, the takeaway is clear:
Mamdani isn’t just leading — he’s already been priced in as the winner.
Final Outlook
With Mamdani sitting at 97% implied probability, the betting market views this race as essentially over. Polls may continue to fluctuate, but the money is speaking loudly.
Zohran Mamdani is the overwhelming betting favorite to become New York City's next mayor.
For a full breakdown of the odds vs polls analysis, along with methodology and sources, please see the dataset here.
You can see where we have been tracking the NYC Mayoral Election betting odds here.
Featured News
-
 FEATURED MAR 12, 2026
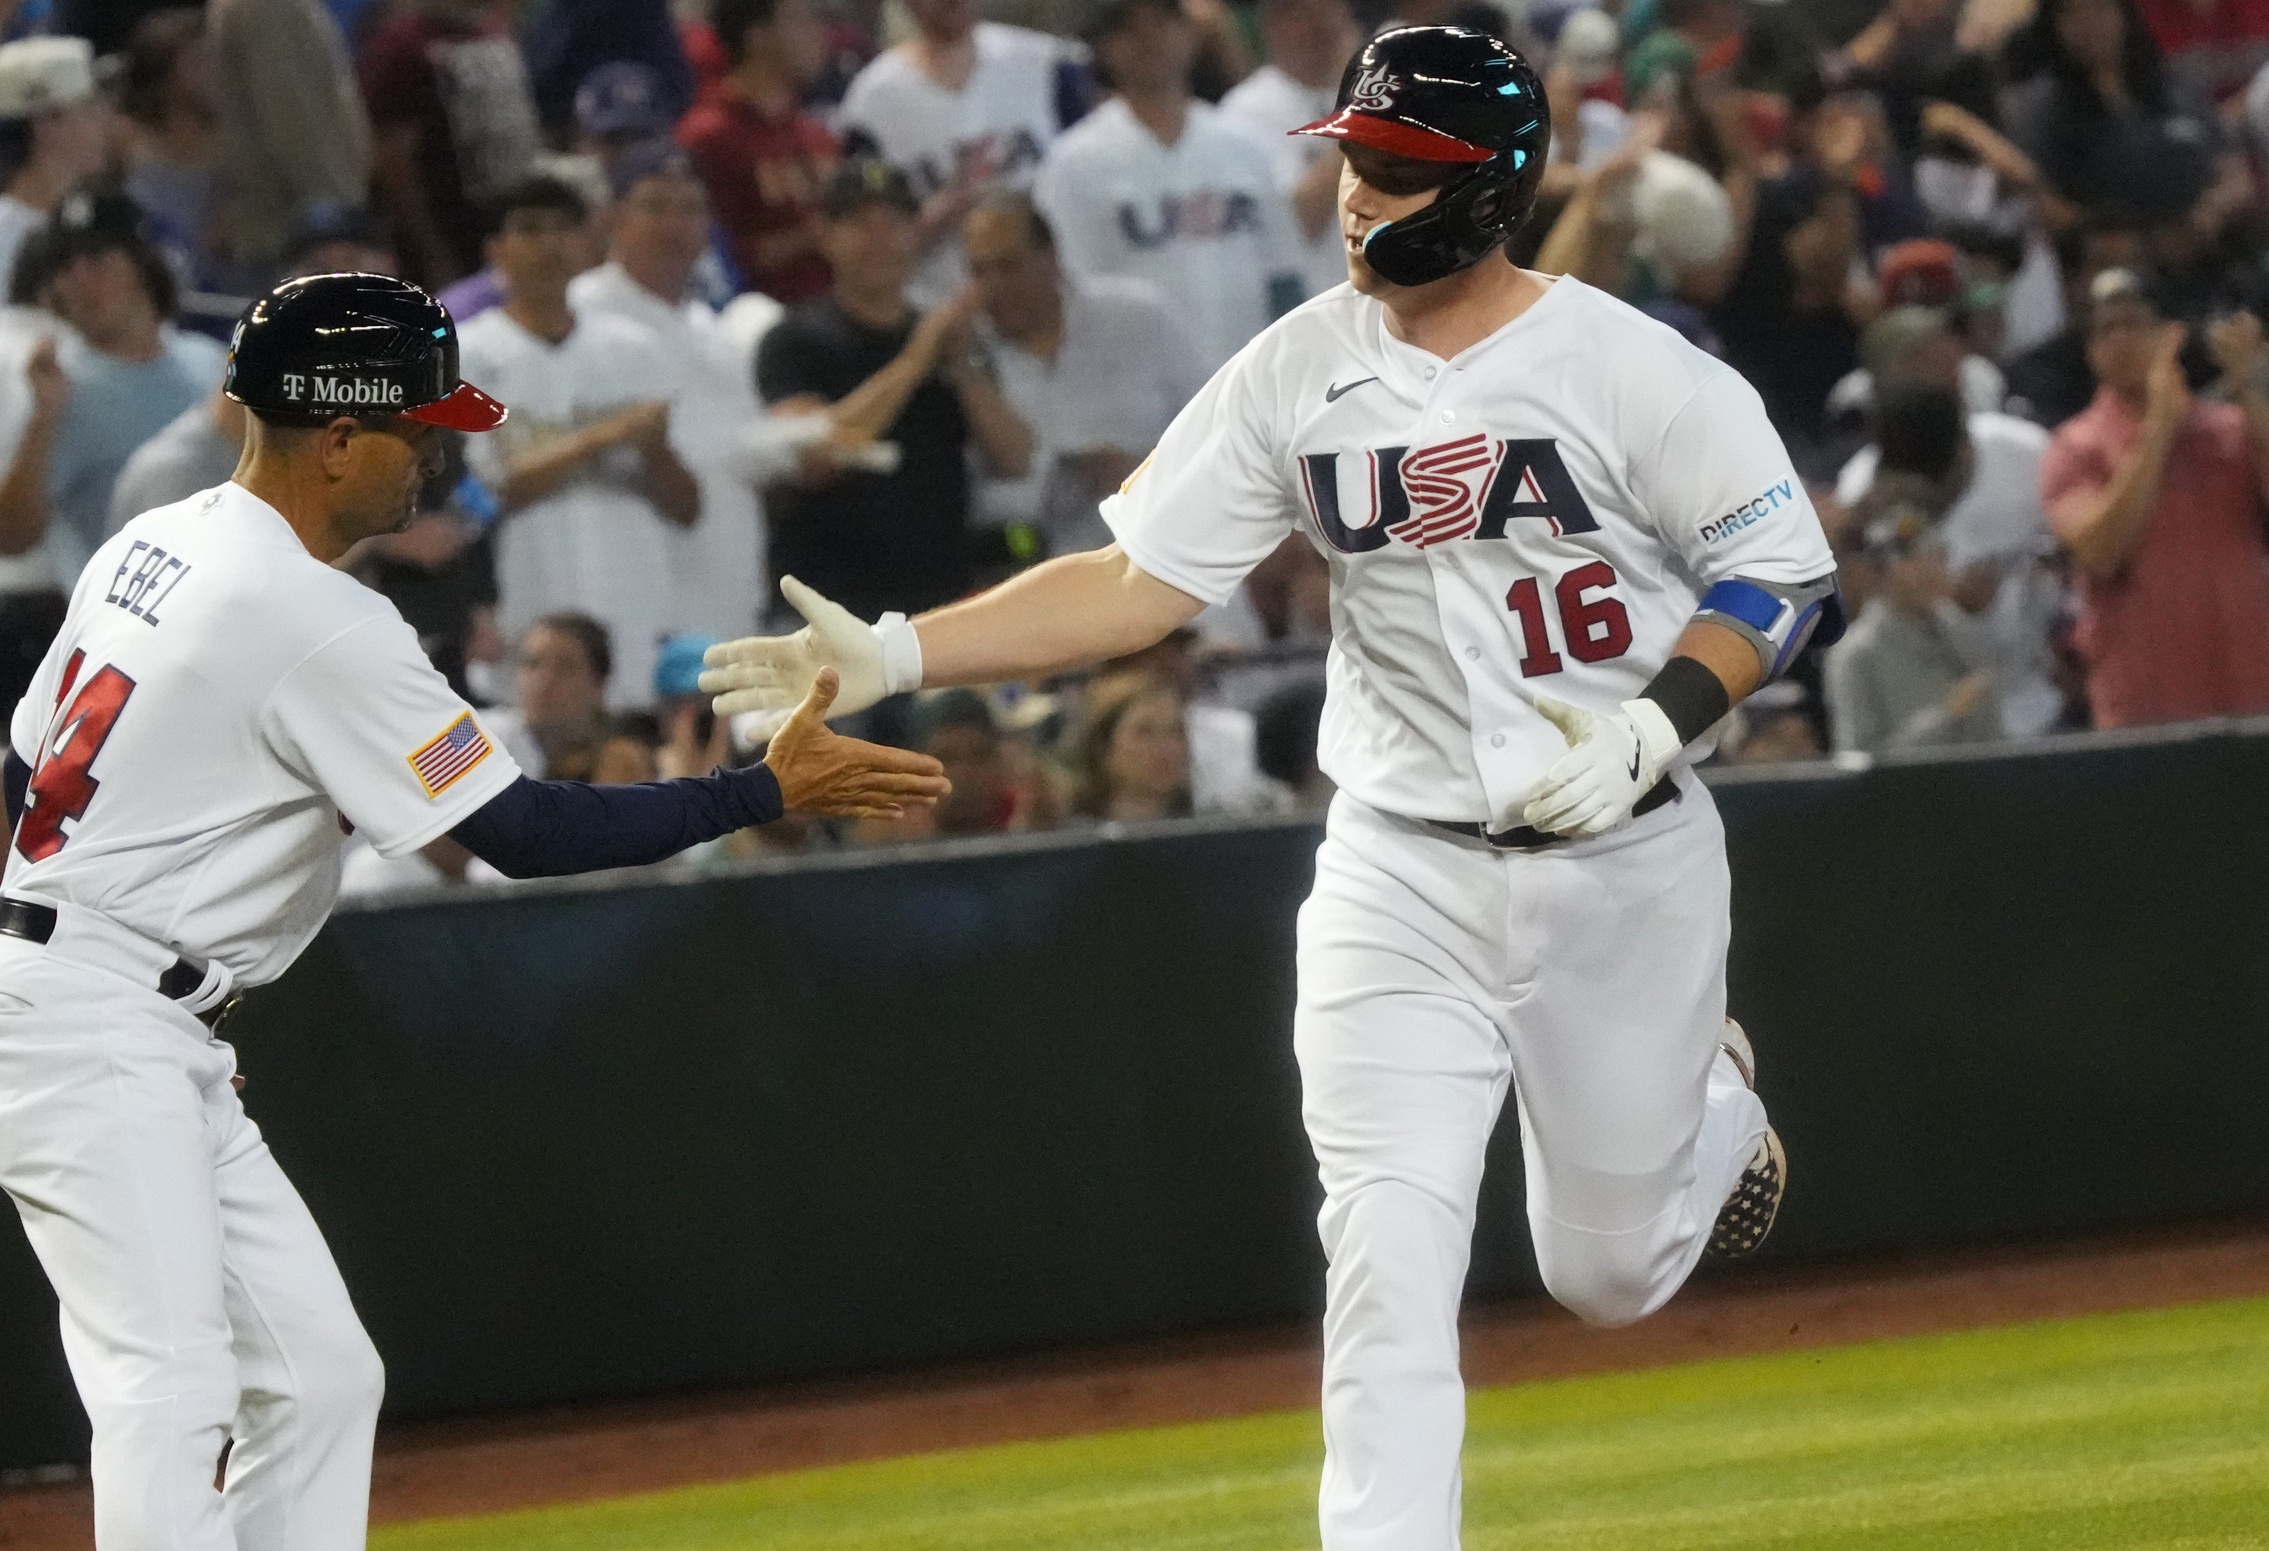
World Baseball Classic Odds: Prediction Market Moves for the 2026 Championship
- FEATURED MAR 15, 2026
2026 SEC Tournament Odds: Lines, Spreads, Betting Trends for Vanderbilt vs. Arkansas
- FEATURED MAR 15, 2026
2026 Big Ten Tournament Odds: Lines, Spreads, Betting Trends for Purdue vs. Michigan
- FEATURED MAR 15, 2026
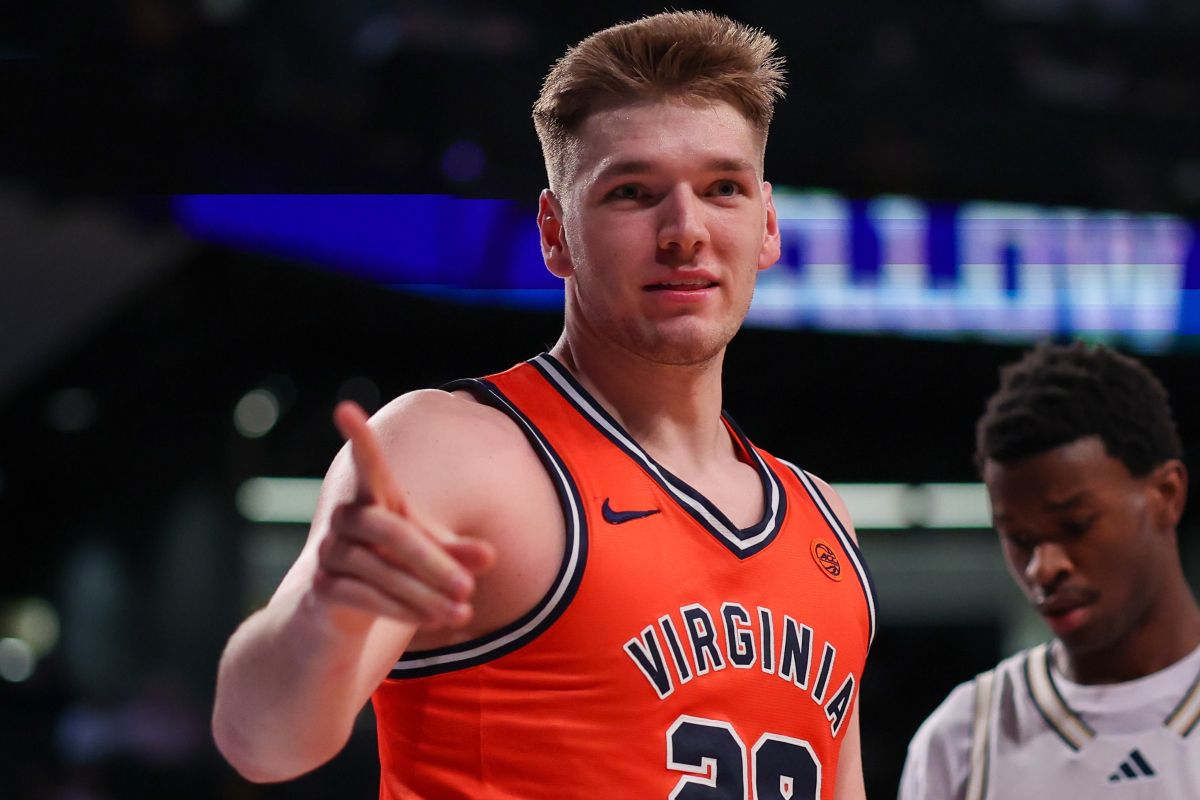
2026 ACC Tournament Odds: Lines, Spreads, Betting Trends for Virginia vs. Duke
- FEATURED MAR 14, 2026
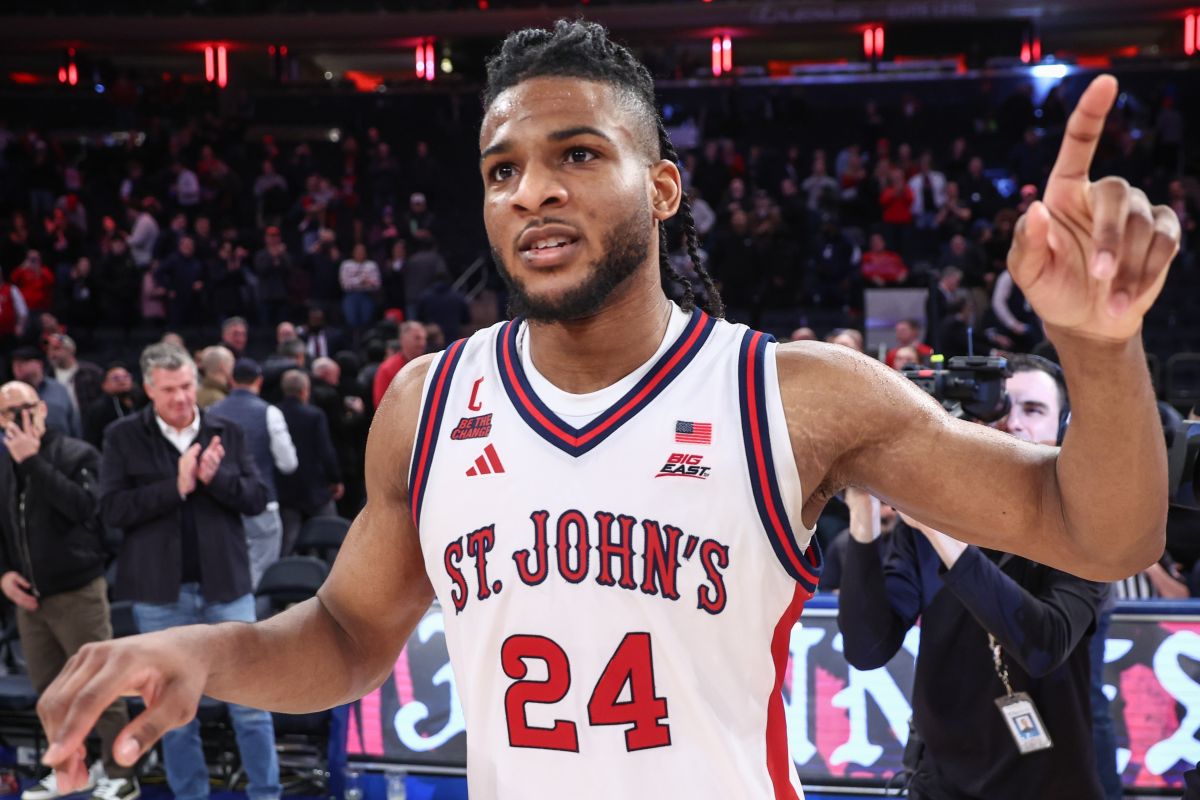
2026 Big East Tournament Odds: Lines, Spreads, Betting Trends for UConn vs. St. John’s
- FEATURED FEB 19, 2026
2026 Oscars Betting Odds, Categories & Information